Developer Studio 2.0
“Developer Studio 2.0 and debugger” is a graphical tool that allows the user to design, configure and test GreenVulcano® ESB business flows.
It is based on Eclipse, also adding the meanings to design, debug and test GV services.
The actors involved in GreenVulcano® ESB business flows implementation are:
- Business Analyst: designs the business flow regardless how to interface systems.
- Technical specialist: configures the flow designed by Business Analyst, adding all technical information needed to interface systems.
At the end of design and configuration job, the user is able to generate an export file containing all necessary GreenVulcano® ESB files, in order to deploy and test the business flows within the GV Console®.
From here, once “Developer Studio 2.0” package is installed (follow our guide in the section Developer Studio 2.0 installation guide to ensure that), we can continue by passing directly on its proper introduction:
- first execution of dev studio 2.0 and its acquaintance
- dev studio sections explanation
- first project overview: let's ECHO a message
- project export/import
- debugger
You may now continue with the first section, about the first execution of dev studio 2.0 and its acquaintance, or follow up with the GreenVulcano ESB server quickguide section.
Following this section we will unveil the Dev Studio behavior: by creating a new project all the main parts will be shown and used.
first execution of dev studio 2.0 and its acquaintance
Once our target Dev Studio 2.0 is installed we may run it executing the file
DeveloperStudio
from its main path.
As for its parent Eclipse, we’ll be prompted for a workspace request: as for our first execution we may leave the path suggested, confirming it with the OK button.
Within the execution, such workspace path will be created onto the main Dev Studio 2.0 path (we’ll get into that in the next sections).
Since it’s our first steps into the development, we’re going to click on the “First Steps” compass icon to follow the internal wizard, being followed step by step by the Dev Studio.
From the next “First Steps” section, we may go to the “New Vulcon Project”:
under the project name we add the value “example_1” (or similar, up to you) and we confirm this with the OK button.
Our first project has been created from scratch: to see it, simply double click on the “Welcome” tab. From there, the developer main window will appear: pressing the green icon with the looping arrow the project will be visualized onto the main menu.
Every fresh project contains at least 1 default service, called ECHO : we’ll see this in a glance. But first, lets see how Dev Studio visually organize its sections.
Dev Studio sections explanation
The upper Quick Menu section contains several speed buttons to obtain some of the function contained in the main menu section (New project, Save, Save All, etc.). Going into Window -> Perspective -> Customize Perspective you can easily add/delete the quick buttons you may need/not need.
The left Main View section contains the heart of the Dev Studio, “Vulcon”, divided in different views, plus a Project Explorer, useful to navigate through the project resources.
Vulcano
Vulcon section contains all the services components defined inside the project, and their related configurations.
There are for sub-sections to unveil:
- Services: contains the services components ( nodes, conditions, subflows etc.)
- System: contains the operations involved by the services parts
- Adapters: contains the definition of the meaning to reach the services (eg. web server exposition)
- Core: contains other types of configuration
Project Explorer
This sections is mainly a resource navigator and editor.
From here every change made inside the Vulcon section can be manually edited, forth and back, using the proper syntax.
GreenVulcano 4 ESB core is heavily XML-based:
its parts are therefore defined into proper XML documents.
If you’re interested, from here you can follow up to a section defining the base elements of the GV tree components, in order to get a full understanding of the GV’s heart and branches.
Flow designer
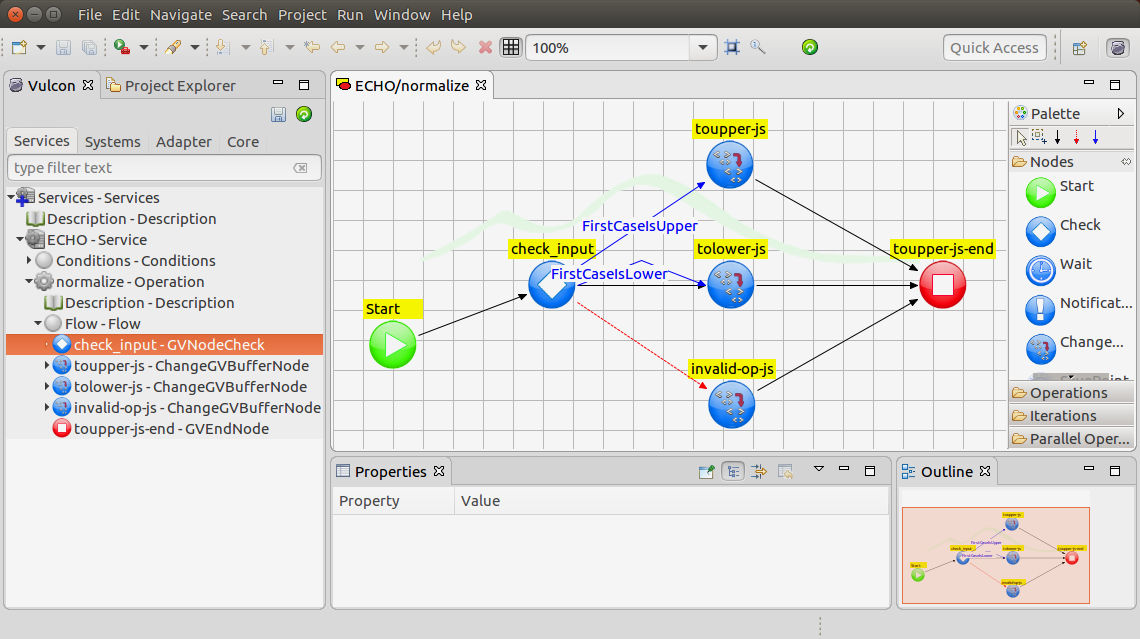
Click to drill down the ECHO-Service, then right mouse button click on the “normalize Operation”, then choose and click the “Open editor” from the list. A new tabbed window will appear inside the Flow Designer section, containing the graphical version of the flow Operation.
At this point, press to drill down the “Flow - Flow” again inside the Vulcon view: this will make appear the whole list of components included inside the Operation flow (nodes, conditions, etc.).
As you can see, a service flow can be seen as a n-ary graph which defines its behavior, with 1 origin node and 1+ ending nodes.
Once started, a flow will begin from the “Start” node, and the execution expressed will be based on the nodes order of execution, starting from the initial input and ending with the final ending node output.
Nodes or other components can be added from the Vulcon (text based view) or from the Flow Designer (graphic based view) simply using the contextual menus given by the Dev Studio: all the addition/changes/deletion made in each one are automatically updated inside the other view, giving the developer the chance to use its own developing style.
Properties
Nodes or other components properties are posted inside this section.
Once a node or other component is selected from either Vulcon or the Flow Designer , its properties are visualized in this section, ready to be edited.
Properties are divided onto BASIC and ADVANCED types: each of the properties can be optional or mandatory. If a mandatory property is left blank, Dev Studio raise a proper error in a form of a red X put in place of the node’s icon, inside the Vulcon section.
If hovered with the mouse cursor, such icon displays the related error, with its proper description.
Palette
This section cointains all the components that can be added into the Flow Designer.
Let’s try it:
- click and hold the mouse on a Check node icon
- now move the mouse curson over the ECHO/normalize window, in a white section of the designed flow
- a new “Node Configuration” window will appear, asking the developer to fill in all the configuration information remaining
- once such info are filled, the button Finish can be pressed
- Done. The new node has been added to the graphical flow, and also on the Vulcon view, of course.
Once added, nodes are to be inter-linked using the connection component, wich includes the used arrow, defining its direction
- black connection: used to simply connect the node A to the node B, meaning “after the execution of A go on with B’s execution”
- blue connection: used to define a conditional connection (see the check type of node section)
- red connection: used to define an error connection, in case of an error output (see the check type of node section)
Outline This section is simply used to have an interactive overview of the Flow Designer, as an aid to the developer.
First project overview: let’s ECHO a message
The default service “ECHO” contains a normalize operation, which is a simple application able to normalize a string, meaning lowering a string starting with a lowercase character or uppercasing a string starting with a uppercased character.
It’s so simple that is usually used to let the user know if the GreenVulcano 4 ESB instance is alive and kicking.
Once deployed, it can be reached and used by the GVConsole.
Flow is designed to get an input string and output it back: upcased inputs will be thrown back as downcased, and viceversa.
From a logic perspective this flow/program simply relies on an initial check based on the input given to the flow: if the input string is downcase the uppercasing branch will be chosen, while an upcasing will be chosen whether is downcase (or otherwise). The remaining cases are error based, like an empty input string case.
So let’s have a look at the Flow Designer windows, component by component, without looking too much under the hood (for now) of the components:
- each flow starts from the Start node: when the service operation starts its session on GV 4 ESB, the core thread runs the flow starting from this node, applying the initial input to it
- the so called “first-node” inherits such initial input as its own input: from this step the flow execution starts. In this case the “first-node” is the check node “check_input”, which will read the initial input value and takes a conditional decision based on its value
- blue conditional connection “FirstCaseIsUpper”: in case of a leading upper character, this will lead to the node in charge of uppering the initial input string, which is a change gv buffer node
- blue conditional connection “FirstCaseIsLower”: in case of a leading lower character,this will lead to the node in charge of lowering the initial input string
- black connection (or the so called otherwise case): in this case the lowering branch is also chosen
- red connection: in case of input with an error
- ending error “toupper-js-end” node: the 3 different change gv buffer node nodes will lead to this node, which is supposed to get the ending output string , whether its a uppered/lowered/error string coming from the 3 change gv buffer node, respectively.
A node can have multiple inbound connections and 1 single outbound connection, unless is a check node which can have 0+ blue conditional connections, 1 default “otherwise” black connection and 1 default error connection.
Plus, a Start node always has 1 single outbound connection, and an End node can only have 1+ inbound connections.
A node with no inbound and no outbound connections (the so called “isles”) are not allowed, and marked as red Xs from Dev Studio.
A node with no inbound and no outbound connections (the so called “isles”) are not allowed, and marked as red Xs from Dev Studio.
As a representation, statically a flow can be seen a graph containing all the actions to take to reach the final goal/output, while dynamically a flow is the actual thread executed containing a part of such actions that actually led to the final goal/output.
The static part is designed at dev-time and instantiated at init-time, while the dynamic is decided at run-time.
Project export/import
Having at our disposal a project with at least one working service, a developer/operational user is able to deploy it into the GV Console, hosted by the GV 4 ESB server.
So, from the Dev Studio 2.0 is possible to export such project into a directly deployable format: from the main view menu “File” press “Export”, then choose from the Export dialogue the VulCon Export Tool drill down, then finally Vulcon Project.
Ultimately, select the project name involved in the export (“example_1”) and type down a filename to be outputted: such filename will be created in .zip compressed format, which will contain all the Vulcon project resource files, ready to be deployed and used.
As explained into the GV 4 ESB server section, the GV Console is the application directed to this purpose so, with the ESB server up, the GV Console can be reached from a simple web browser.
From here, the ECHO service can be deployed onto GV 4 ESB simply follow the deployment example section.
A Vulcon project file can be also imported onto Developer Studio (for example, a client configuration taken from its GVConsole) to eventually maintain or evolve its configuration:
from the Dev Studio main menu simply press “Import” then select the zip Vulcon project.
The resulting service will be added to the present workspace used.
An important note:
a default Vulcon Project is meant to contain 1+ single service leading to 1+ possible operations, each.
Therefore, features like Dev Studio import/export deal in project in such terms: each time the import/export feature is used the user will be prompted on which service to import to/from the workspace, given that the Dev Studio let you edit/design just one service at a time.
Debugger
Another great feature of Dev Studio 2.0 is the visual Debugger, which allows the developer to test and interact with the flow execution.
To use this feature, simply have GV 4 ESB run and ready, and then execute Developer Studio 2.0.
At this point, from the Vulcon section select and click with the right mouse button over a service operation (normalize or simpleReport feasable examples, if the reader has already prepared them): from there simply click over Deploy and Debug.
At this point Dev Studio will connect to the local GV 4 ESB instance sending the code involved , deploying automatically the whole operation on the server and make it available to test.
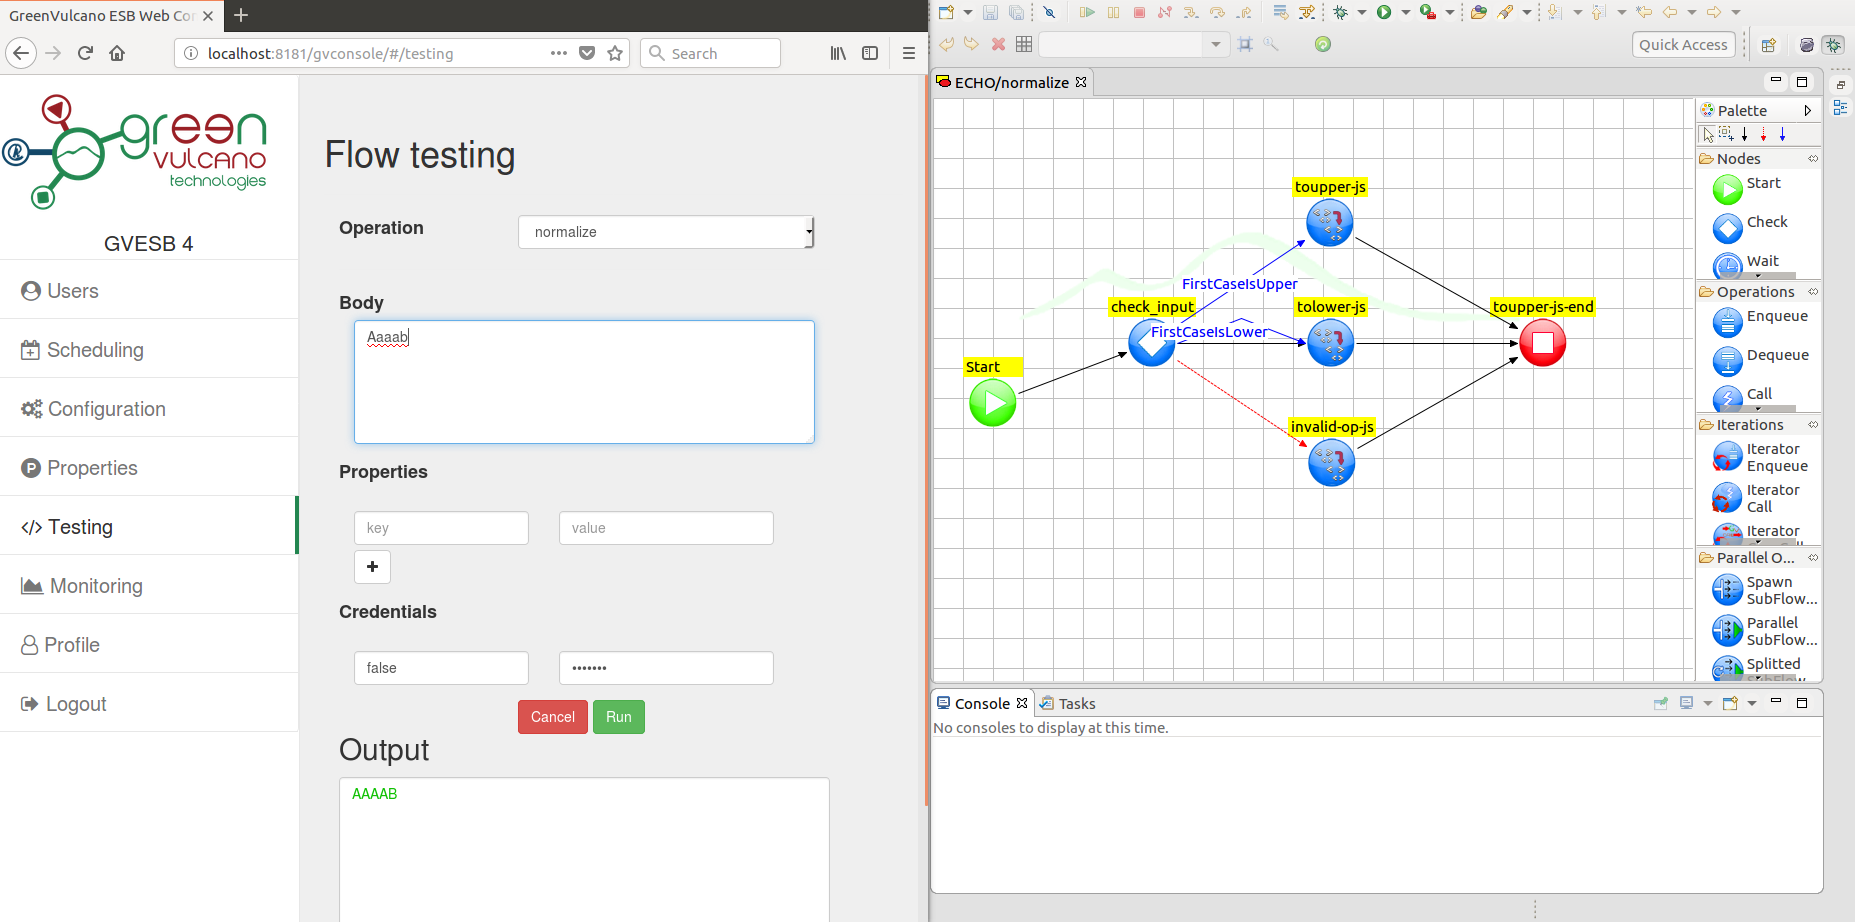
In case of normalize, then simply reach the GVConsole from the browser, at the Testing section: select the normalize operation from the service list, input a string in the memo section then start the operation with the green Run button.
At this point get back to the Dev Studio: you should see the Dev Studio switched onto the Debugger section, with the normalize operation prompting for interaction.
From there the traditional debugging quick buttons can be used: Step Into/Over/Return and Stop, to interact with the time flow
For example, with the Step Into button the user can see how the flows evolve in time interacting with the input data towards the End node.
The upper right section of the Debugger contains the watches necessary to check on the main objects and node properties of the operation: *it also lets to change the values directly during the execution*, allowing the user to make different kinds of tries and tests!